Recently I was investigating some Firefox crashes that were occurring in the
style system, somewhere in Rust code. These were persistent, low frequency
crashes, being reported around 25 times per day. Our
crash report database,
crash-stats, indexes
crashes by signature, which is the top one or more stack frames. From the
bug report, I could see that these crashes were all in the same function,
although the exact stack trace that led to calling this function varied
across crashes.
On a good day, looking at a crash report will reveal the bug without too
much effort. For example, it’s usually easy to see when a null pointer has
been dereferenced (the address being read or written will be somewhere
around 0x0), and hopefully it’s obvious from looking at the
surrounding code whether a null pointer should have been guarded against.
On a bad day, you can spend hours working backwards from the crash, trying
to work out how the program ended up where it did.
These style system crashes made no sense to me. They were all crashing
at different places in the function. There were all sorts of crashes –
read and write access violations, illegal instructions, at all kinds of
addresses. After staring at a few crash reports and the corresponding
source code for some time, I decided instead to download one of the crash’s
minidumps
to see if it revealed anything more. Minidumps are files that contain
information about the crash, including the exception, the state of all the
registers, and, importantly some portions of memory from the crashing process.
Much of the information in a minidump is shown on the crash report server,
although privacy sensitive information is not shown. When Firefox crashes, the
crash
reporter will capture a minidump and submit it to crash-stats.
Using WinDbg
Minidumps can be loaded into Windows debuggers like Visual Studio and
WinDbg. If you have
correctly configured the debugger’s
symbol
server path, it can download debugging symbols to provide a readable
stack trace.
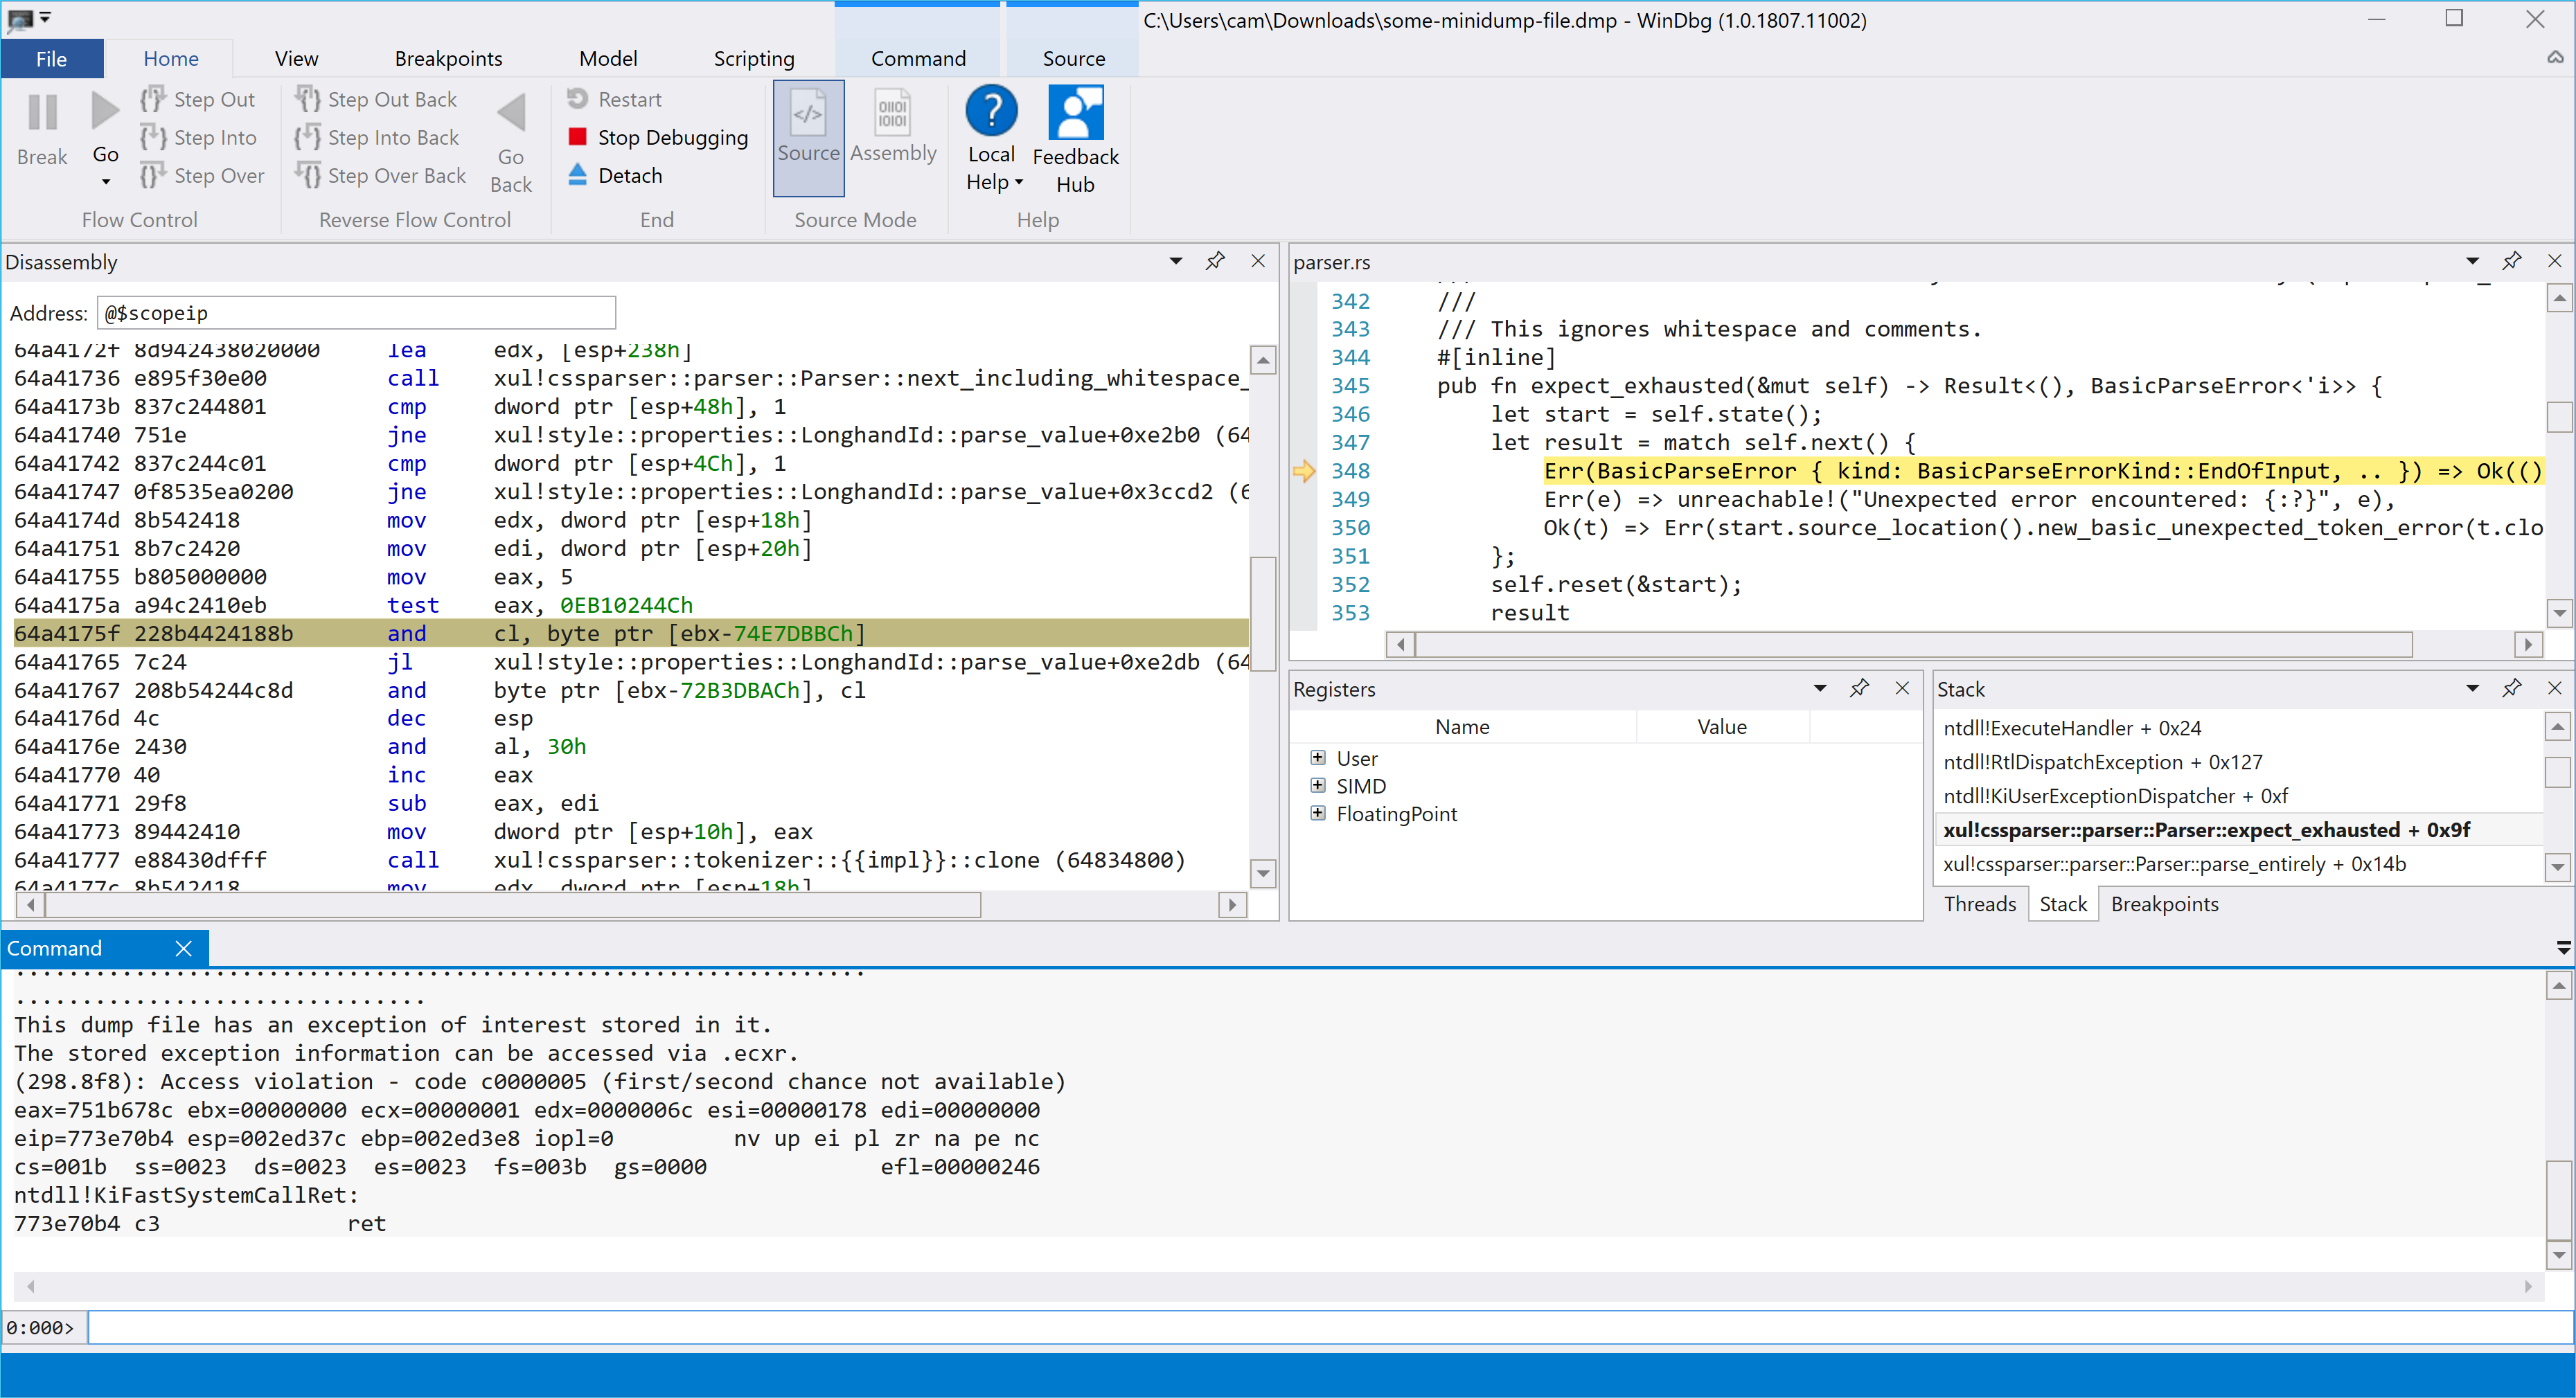 WinDbg with a minidump open.
Typing .ecxr into the WinDbg command window will show
information from the exception content record in the minidump.
0:000> .ecxr
eax=00000005 ebx=64a3033c ecx=00000004 edx=000098c9 esi=002eec58 edi=000098a7
eip=64a4175f esp=002ed908 ebp=002edf40 iopl=0         nv up ei pl nz na po nc
cs=001b  ss=0023  ds=0023  es=0023  fs=003b  gs=0000             efl=00010202
xul!cssparser::parser::Parser::expect_exhausted+0x9f [inlined in xul!style::properties::LonghandId::parse_value+0xe2af]:
64a4175f 228b4424188b    and     cl,byte ptr [ebx-74E7DBBCh] ds:0023:efbb2780=??
Here we can see the instruction that we crashed on, and it looks pretty odd.
We’re taking ebx as a pointer, indexing it with a very large
negative value, and trying to read a byte from that memory location. Given our
instruction pointer is 0x64a4175f, the ebx value
looks like it is somewhere within code. The indexing sends us way off, wrapping
around the top of address space, where we have no memory mapped, and we
crash. What’s going on?
At this point, I remembered WinDbg’s
!analyze
command, which does a bunch of automatic analysis of the current exception.
I don’t know what the full set of analyses this command does, but with this
crash it pinpointed the problem exactly:
0:000> !analyze -v
*******************************************************************************
*                                                                             *
*                        Exception Analysis                                   *
*                                                                             *
*******************************************************************************

...
EXCEPTION_RECORD:  (.exr -1)
ExceptionAddress: 64a4175f (xul!cssparser::parser::Parser::expect_exhausted+0x0000009f)
   ExceptionCode: c0000005 (Access violation)
  ExceptionFlags: 00000000
NumberParameters: 2
   Parameter[0]: 00000000
   Parameter[1]: efbb2780
Attempt to read from address efbb2780
...
CHKIMG_EXTENSION: !chkimg -lo 50 -d !xul
    64a4175a - xul!style::properties::LonghandId::parse_value+e2aa
	[ 89:a9 ]
1 error : !xul (64a4175a)
...
BUGCHECK_STR:  APPLICATION_FAULT_INVALID_POINTER_READ_MEMORY_CORRUPTION_ONE_BIT
...
I chopped out a bunch of irrelevant output, but the interesting result
from !analyze is that it discovered memory corruption, and it
helpfully pointed out that it’s a single bit of corruption. It used the
chkimg extension (which can be invoked by itself with
!chkimg) to discover that the byte at 0x64a4175a was
0xa9 when it should have been 0x89.
That corrupted byte is just a few bytes before the instruction that
we crashed on. The instructions that were actually executed were:
0:000> u 64a4175a 64a41764
xul!cssparser::parser::Parser::expect_exhausted+0x9a [z:\build\build\src\obj-firefox\toolkit\library\i686-pc-windows-msvc\release\build\style-25f47d697d295d08\out\properties.rs @ 38635] [inlined in xul!style::properties::LonghandId::parse_value+0xe2aa [z:\build\build\src\obj-firefox\toolkit\library\i686-pc-windows-msvc\release\build\style-25f47d697d295d08\out\properties.rs @ 38635]]:
64a4175a a94c2410eb      test    eax,0EB10244Ch
64a4175f 228b4424188b    and     cl,byte ptr [ebx-74E7DBBCh]
To see what instructions we should have been executing, we can ask
!chkimg to fix the corruption:
0:000> !chkimg -d -f !xul
Warning: Any detected errors will be fixed to what we expect!
    64a4175a - xul!style::properties::LonghandId::parse_value+e2aa
	[ 89:a9 ]
1 error (fixed): !xul (64a4175a)
0:000> u 64a4175a 64a41764
xul!cssparser::parser::Parser::expect_exhausted+0x9a [z:\build\build\src\obj-firefox\toolkit\library\i686-pc-windows-msvc\release\build\style-25f47d697d295d08\out\properties.rs @ 38635] [inlined in xul!style::properties::LonghandId::parse_value+0xe2aa [z:\build\build\src\obj-firefox\toolkit\library\i686-pc-windows-msvc\release\build\style-25f47d697d295d08\out\properties.rs @ 38635]]:
64a4175a 894c2410        mov     dword ptr [esp+10h],ecx
64a4175e eb22            jmp     xul!style::properties::LonghandId::parse_value+0xe2d2 (64a41782)
64a41760 8b442418        mov     eax,dword ptr [esp+18h]
64a41764 8b7c2420        mov     edi,dword ptr [esp+20h]
That one bit of corruption made a big difference!
But how is !chkimg able to find the corruption?
The crash reporter includes 0x400 bytes around the crashing
instruction in the minidump, which is how the debugger knows what was actually
executed. Both Microsoft’s and Mozilla’s symbol servers not only store debugging
symbols, but also the modules that the crashing process had loaded. Here, this
includes the xul.dll module we crashed in. The
!chkimg command downloads the modules from the symbol server and
compares their contents to the ranges of memory that are stored in the minidump,
including those 0x400 bytes.
Checking a number of other crash reports with the same signature, all had
memory corruption to some degree. Whether they were caused by bad RAM, bad
disk, or a
passing
cosmic ray, I don’t know, but I was able to conclude that this bug
didn’t need to be investigated further. I also learnt that before spending
too much time debugging a seemingly inexplicable crash report, I should
check for memory corruption first.
If you’re not on Windows
Ideally, this kind of analysis for memory corruption would be done by
the crash report processor, so that it could be shown on
crash-stats.
Bug 1274628
is open on this.
In the meantime, I thought it would be handy to have a cross-platform command
line tool to do it, since it’s not always convenient to boot up Windows to run
WinDbg. I wrote a small Rust program that reads a minidump, downloads binaries
from symbol servers, and performs the memory corruption check. (This was mostly
just a matter of hooking up some existing crates, like
this Portable Executable parser and
Ted Mielczarek’s minidump parser,
and doing a few HTTP requests.)
$ chkimg --symbol-cache=/tmp/symcache \
> --symbol-server=https://msdl.microsoft.com/download/symbols \
> --symbol-server=https://symbols.mozilla.org/ \
> /tmp/some-minidump-file.dmp
info: looking for xul.dll at https://msdl.microsoft.com/download/symbols...
info: looking for xul.dll at https://symbols.mozilla.org/...
info: fetching xul.dl_ from https://symbols.mozilla.org/...
info: looking for ntdll.dll at https://msdl.microsoft.com/download/symbols...
info: fetching ntdll.dll from https://msdl.microsoft.com/download/symbols...
crashing IP: 0x64a4175f
mismatch: 0x64a4175a .. 0x64a4175a (1 byte) in xul.dll
  [ a9 ] should be [ 89 ]
mismatch: 0x64a418e2 .. 0x64a418e3 (2 bytes) in xul.dll
  [ a7 64 ] should be [ 49 10 ]
The output isn't as rich as WinDbg’s, and notably it doesn’t do any
disassembly to help you understand what the instructions were and should
have been, but you can at least see there is corruption close by to the
crashing instruction pointer.
If you have a Windows crash report you can’t make sense of, give it a
try.
chkimg is available on GitHub.