On OS X 10.9, the Xcode command line utilities package no longer includes GDB. Instead, LLDB – the debugger from the LLVM project – is the officially supported debugger. LLDB’s syntax is a little different from GDB’s, but it doesn’t take too long to get used to. The LLDB site has a handy table showing the equivalent LLDB commands for a number of common GDB commands.
One barrier to switching, for me, was that I have a few GDB commands defined in my .gdbinit file that I use for debugging Firefox. Most of my .gdbinit was cribbed from Boris Zbarsky’s a few years ago, but nowadays there is a .gdbinit file in the tree. So over the last couple of days I’ve ported the commands over to a .lldbinit file in the tree.
LLDB uses Python as its scripting language, and most of the commands that have been ported over are written in Python. The .lldbinit file imports the lldbutils module, which lives in python/lldbutils/. The README.txt file in there documents all of the currently supported Gecko-specific functionality.
For example, the prefcnt command can be used to show the refcount of an object. Unlike the one in .gdbinit, the LLDB version of this command can take an argument that is a reference to a refcounted object, a pointer to one or one of our smart pointers to one:
(lldb) p this
(nsHTMLDocument *) $1 = 0x0000000116e9d800
(lldb) prefcnt this
20
(lldb) p mDocumentURI
(nsCOMPtr) $3 = {
  mRawPtr = 0x0000000117163e50
}
(lldb) prefcnt mDocumentURI
11
In addition to a few commands, I’ve added a couple of type summaries to begin with. In LLDB, a type summary is a rule for how to display a value. This is useful for types like our string types, where you otherwise have to bury in to find the right member variable to get the string out. With the nsAString and nsACString type summaries, you can just print the string object and the string value in it will be shown.
(lldb) frame info
frame #0: 0x000000010400cfea XUL`nsCSSParser::ParseProperty(this=0x00007fff5fbf5248, aPropID=eCSSProperty_margin_top, aPropValue=0x00007fff5fbf53f8, aSheetURI=0x0000000115ae8c00, aBaseURI=0x0000000115ae8c00, aSheetPrincipal=0x000000010ff9e040, aDeclaration=0x00000001826fd580, aChanged=0x00007fff5fbf5247, aIsImportant=false, aIsSVGMode=false) + 74 at nsCSSParser.cpp:12851
(lldb) p aPropValue
(const nsAString_internal) $16 = u"-25px"

(lldb) p this
(nsHTMLDocument *) $18 = 0x0000000115b56000
(lldb) p mContentType
(nsCString) $19 = {
  nsACString_internal = "text/html"
}
LLDB also provides the ability to define synthetic children for a type, which are fake member variables. They can be used to expose the elements of container data structures. For example, synthetic children for nsTArray and friends now let you inspect the array as if it were a plain array type, instead of just seeing an mHdr member:
(lldb) frame info
frame #0: 0x00000001043eb8a8 XUL`SVGTextFrame::DoGlyphPositioning(this=0x000000012f3f8778) + 248 at SVGTextFrame.cpp:4940
(lldb) p charPositions
(nsTArray<nsPoint>) $5 = {
  [0] = {
    mozilla::gfx::BasePoint<int, nsPoint> = {
      x = 0
      y = 816
    }
  }
  [1] = {
    mozilla::gfx::BasePoint<int, nsPoint> = {
      x = 426
      y = 816
    }
  }
  [2] = {
    mozilla::gfx::BasePoint<int, nsPoint> = {
      x = 906
      y = 816
    }
  }
}
(The nsPoint type looks like it could do with type summary to make it more compact, though!)
Loading the .lldbinit
LLDB by default looks in two places to load a .lldbinit file: the current directory when you start it, and your home directory. In addition to the .lldbinit in the root of the source tree (which is where I normally launch my debugger from), the build system puts stub .lldbinit files in your objdir, so that commands like mach reftest --debugger=lldb will pick it up, and next to the final firefox (or other application) binary, in case that’s where you start the debugger from. These stub files just load the main .lldbinit.
So if you are running lldb yourself or through mach, you shouldn’t need to do anything extra to load the in-tree .lldbinit.
Loading it in Xcode
Although the .lldbinit file works fine in Xcode, there is unfortunately no way to add a project-specific .lldbinit file in Xcode that will get loaded automatically. Probably the best approach is to load it from your ~/.lldbinit. If you are happy with the Gecko debugging commands being available regardless of what you’re debugging with LLDB, then add these lines:
script topsrcdir = "/path/to/a/mozilla/tree"
command source -s true "/path/to/a/mozilla/tree/.lldbinit"
where “/path/to/a/mozilla/tree” is any checkout of mozilla-central you’re likely to keep up to date. The topsrcdir Python variable is used to tell the in-tree .lldbinit where the lldbutils module can be found.
If instead you want to manually enable the commands within Xcode whenever you want to use them, you could make the command source an alias:
script topsrcdir = "/path/to/a/mozilla/tree"
command alias gk command source -s true "/path/to/a/mozilla/tree/.lldbinit"
and then you can type gk at the LLDB prompt in the Xcode debugger window to load it.
In addition to the Gecko debugging commands being available, type summaries and synthetic children will be used whereever values are shown in the Xcode interface, like the Variables panel of the Debug area or when mousing over variables in a source file while debugging.
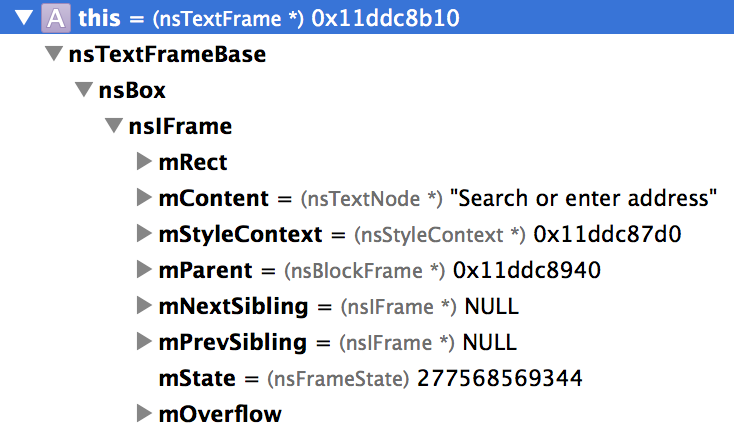
See how the mContent of the nsTextFrame, which is an nsTextNode, has its type summary displayed next to its pointer value.
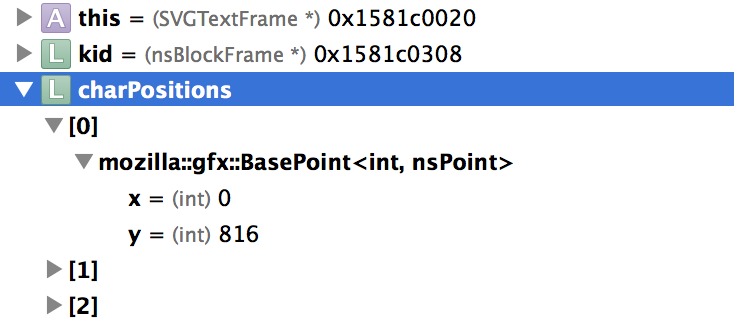
Here the elements of the nsTArray<nsPoint> are shown and can be expanded as if they were plain array elements.
What’s available now?
So far these commands are available:
- frametree (ft), frametreelimited (ftl)
These commands dump out information about the layout frame tree. The “limited” version dumps a subtree, rather than the tree for the whole document.
- js
Prints a backtrace of the current JS stack.
- prefcnt
Prints the refcount of a refcounted object.
- pstate
Prints the state bits of an nsIFrame in symbolic form, rather than as a uint64_t (once bug 960848 relands).
- ptag
Prints the tag name of a given nsINode.
These types have type summaries:
- nsAString, nsACString
Shows the contents of the string.
- nsIAtom
Shows the atom’s string.
- nsTextNode
Shows the text node’s string value.
And the only type to have synthetic children so far is nsTArray, as mentioned above.
Check the README file for examples and more information.
Let’s add more!
If you have any GDB commands that you’d like to see ported over to LLDB, or have ideas for other useful commands and type summaries, file a bug CCing me and I’ll see what I can do!